Charting Your Story's Rising Action
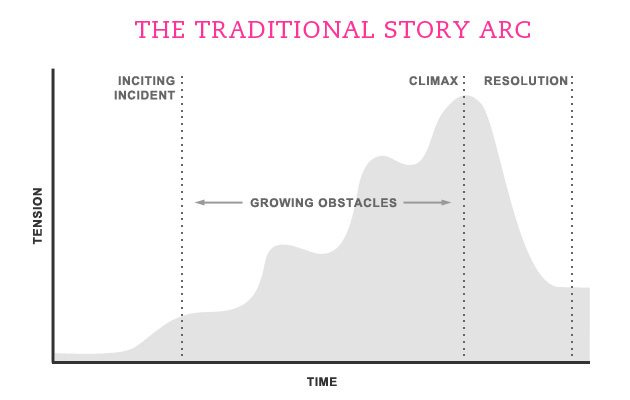
Rising Action is the part of your story that begins after the inciting incident and ends at the story's climax. (Read a great post by Susan about the inciting incident here.) As Erin explained in her fabulous post about cliffhangers, (that you can read here) after the inciting incident, “the character faces a series of increasingly challenging obstacles.” Here is the graph of this basic story structure that Erin used in that post.

What I want to write about today is the importance of that section of the graph between the first two dotted vertical lines, the section labeled “Growing Obstacles.” This is where rising action takes place. Rising action is crucial to drawing the reader in and keeping her turning pages. As a writer, you want the graph of the tension in your story to resemble the one above, rather than, say, a graph of Facebook’s stock price. (See the graph below, courtesy of businessinsider.com.)

You probably already know all about the importance of rising action. (I'm sure you know you don't want the tension in your story to drop like Facebook's stock!) What I hope to provide through this post is one method that can be used to identify and correct problems you may be having with this aspect of your story. This is a technique that I have devised to help me view my own conflict visually and identify sections where tension is lagging. It's intended to be used in the revision process, as a purely diagnostic tool. (I certainly don't believe that the "art" of writing can be replaced by numbers and charts! But I do believe that this tool can help identify problems in a muddled first draft.)
Step 1 – Take your draft and break it down into scenes. Number your scenes according to the order in which they appear in your story – the first scene is 1, the second scene is 2, etc..
Step 2 – Assign each scene a value based on its level of tension. (It helps to keep the values in a specific range, such as 1-30 or 1-50.) Remember, “tension” can exist in many forms. Think in terms of your character’s comfort zone. The further he or she is outside that comfort zone, the higher the tension. Assigning these values can be tricky, especially since your protagonist may adapt to the rising tension and seem fairly comfortable in very perilous circumstances by the middle of the book. As you look at each scene, imagine your character as he or she existed before the opening of the story. For instance, Harry Potter, as he existed at the beginning of Book One, would have felt an immense amount of tension upon facing the three-headed dog, though the character has grown quite a bit by the time that scene occurs and seems to handle the stress fairly well. Still, assign the scene a value based on the tension that would be felt by the character as he existed at the opening of the book.
Step 3 – Open up a new workbook in Excel. In each row, type the value you’ve assigned to the tension in that scene. (For example, in row 1 type the value you assigned to the first scene, in row 2 type the value you assigned to the second scene, and so on.)
Step 4 – Create a line graph of your list of values using Excel’s graphing feature.
Step 3 and 4 (alternate) – If you don’t have access to Excel or are unfamiliar with its features, you can use a simple sheet of graph paper to plot the values and create a graph of your rising action. Use the horizontal axis for your scene numbers and the vertical axis for the tension values you’ve assigned to each scene.
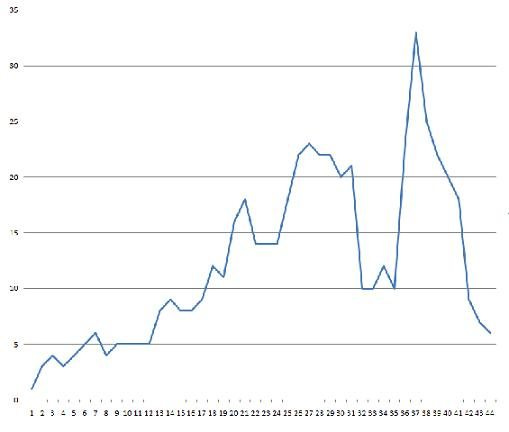
For this post, I made up a set of values for an example, assigning each of 44 scenes a value between 1 and 35. The resulting chart is below:

As you can see, this exercise reveals some issues with the level of tension in this example, beginning around scene number 31. If you charted the tension of your own story and got a graph that looked like this one, you would be instantly clued in that you needed to find ways to keep the tension building after that 31st scene.
Keep in mind that all stories are different. Sometimes an author may intentionally back the tension off a bit to prevent the reader from burning out before she gets to the ultimate confrontation and the climax of the story. Don’t assume the only successful graph will look exactly like the one at the top of this post. However, it is generally accepted that rising action is an important element in maintaining interest and building momentum to a satisfying conclusion.
How about you? Do you have any methods or techniques that help you ensure that your conflict keeps growing and the tension continues to build? What do you think of this method for visually charting your story’s tension? Please share your thoughts in the comments!
